Why Every World Map Distorts Something
Every flat world map makes trade-offs in area, shape, distance or direction. Learn how projections work and how to choose a map that fits the question you are asking.
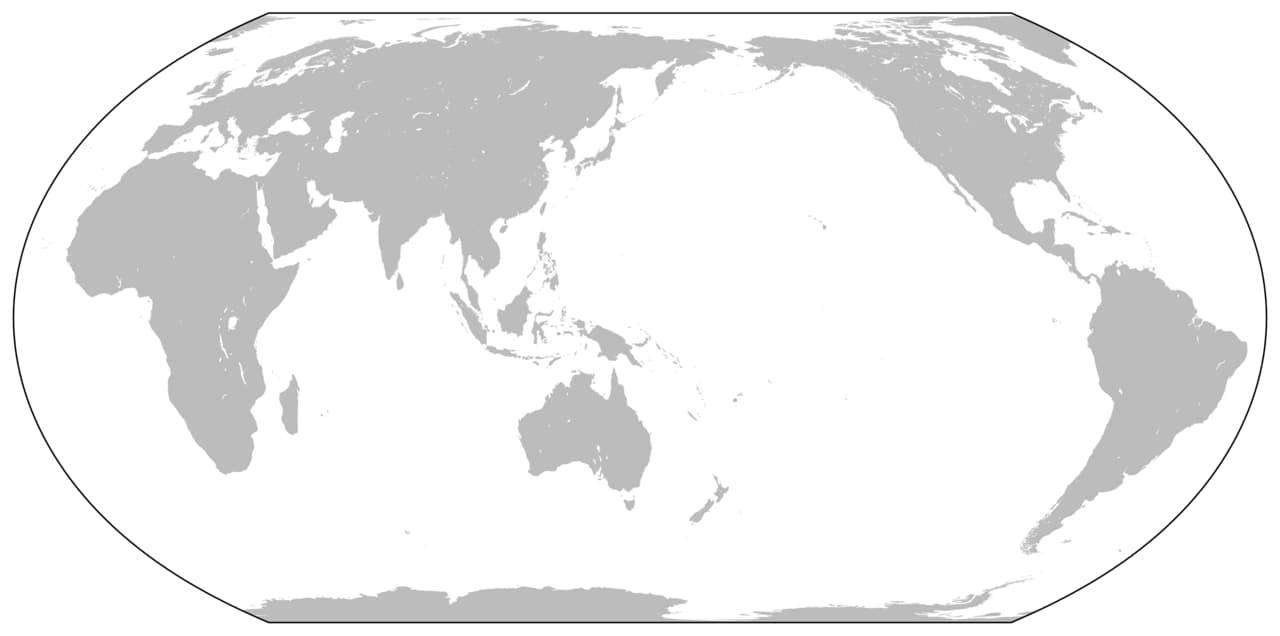
A world map can look authoritative while quietly changing the apparent size or shape of places. That does not automatically make it a bad map. Flattening Earth's curved surface requires compromises, and a map projection is a mathematical way of making them. The important question is which properties the projection preserves and whether those properties suit the task. There is no flat world map that does every job perfectly.
A globe and a flat sheet have different geometry
The US Geological Survey explains that a projection portrays part or all of Earth's curved surface on a flat surface. Distortion is unavoidable. A mapmaker must choose how to distribute it and which features matter most for the intended use. A globe avoids the same flattening problem, though a small globe has its own practical limits for showing detail.
An orange peel is a familiar analogy: trying to spread it flat introduces gaps, stretching or tearing. A mathematical projection does not literally peel Earth, but the comparison makes the difficulty tangible. The challenge comes from geometry, not a failure to find the one clever drawing that removes every compromise.
Area and shape are separate properties
A map may preserve relative areas while altering shapes. Another may preserve local angles and shapes while changing apparent size, especially across a world view. These differences explain why the same landmass can look stretched, enlarged or compressed in different projections without its actual geography having changed.
If your question concerns the relative size of regions, choose a representation designed to preserve area. If it concerns another property, a different projection may be more useful. The word accurate needs a follow-up: accurate in which respect? A map can be excellent for one comparison and unsuitable for another.
Distance is not automatically uniform
A printed scale bar can be helpful, but a world map's scale may vary by location and direction. The USGS notes that equidistant projections preserve distance only along particular lines or from specified reference points. A projection's name does not mean every possible measurement between any two places is correct.
That matters when a route looks surprisingly short or long on a familiar map. Before measuring, check whether the representation supports the intended comparison. For actual travel planning or geographic analysis, use an appropriate tool and dataset rather than drawing a ruler line across an arbitrary image of the world.
The familiar Mercator view has a purpose
Mercator maps are often discussed through the enlargement of high-latitude areas. That distortion is real, but it belongs to a projection with particular navigational properties. A classic Mercator straight line represents a constant-bearing route, while area distortion increases toward the poles. It should not be treated as an equal-area picture of the world.
The useful response is to recognize the purpose and limits, not to conclude that every use of the projection is deceptive. A tool designed for one job can produce a misleading impression when used for another. The same distinction applies to many representations that seem familiar enough to escape scrutiny.
A straight line may not mean the shortest route
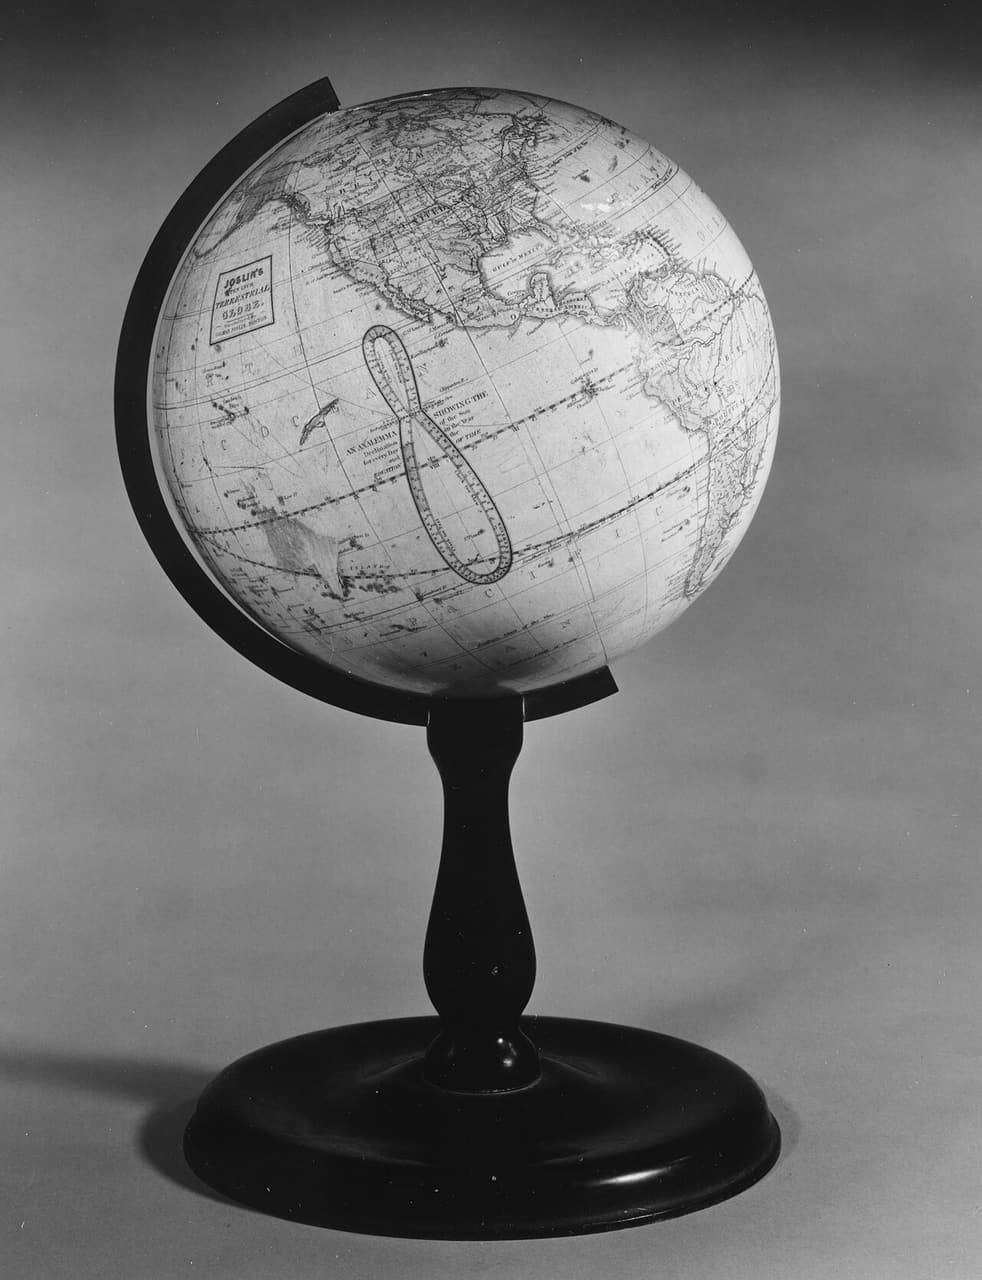
On a globe, the shortest surface route between two points follows a great-circle path. On many flat maps, that route appears curved. A straight line across the page therefore does not universally represent the shortest journey over Earth's surface. The projection changes how the geometry is displayed.
This is why a flight route can look unintuitive on a world map while making sense on a globe. Avoid interpreting the curve as evidence of a strange detour without checking the representation. The map is translating a curved surface, so the visual meaning of straightness depends on that translation.
Scale and extent change the practical compromise
A map of a small area does not face exactly the same practical trade-off as a map covering the entire planet. The USGS highlights how an appropriately oriented projection can keep distortion very small over a limited region. The extent being shown is therefore part of the map's design, not merely a crop chosen after everything else is settled.
Ask whether you need a world overview, a continental comparison or a local route. A single image is unlikely to serve all three equally well. Zooming into a screenshot does not add the geographic detail or projection suitability that a purpose-made local map can provide.
Read the map before reading the conclusion
Look for the projection, scale, legend, date and source. Ask what the map is trying to communicate and which visual property carries the argument. If a graphic compares regions using apparent area, an area-preserving representation matters. If it shows categories or boundaries, the data and legend introduce additional questions beyond projection alone.
Changing a map's central meridian or orientation can also alter what feels central or peripheral. Those choices do not by themselves change the data, but they affect the viewer's first impression. Comparing two maps of the same information can reveal how presentation shapes attention.
A useful world map is an informed compromise. Learn what it preserves, notice where distortion grows and choose a representation that matches the question. That habit turns an apparently simple picture into a more transparent tool—and makes it harder for familiar shapes to substitute for careful geographic thinking.